Injury Timeline Dynamics and Stake Adjustments in College Football Spread Markets
Ines Walter · Aug 23, 2026
Injury Timeline Dynamics and Stake Adjustments in College Football Spread Markets
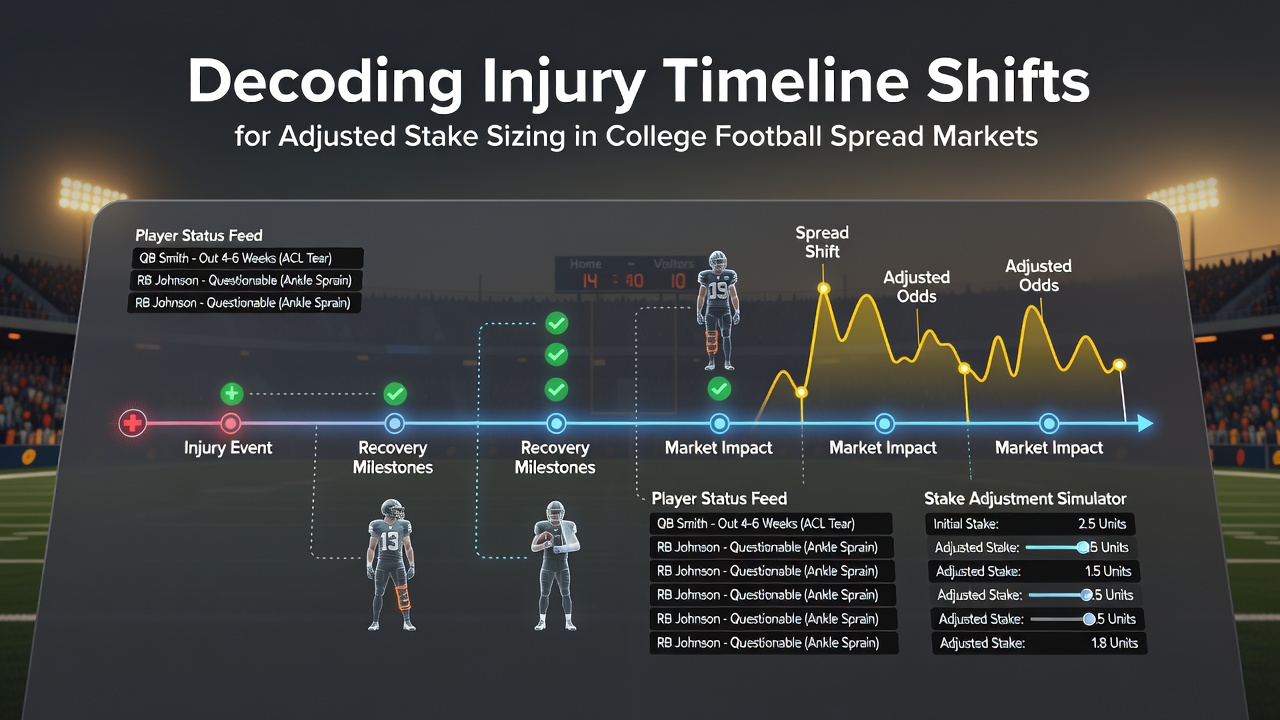
College football spread markets respond directly to updates on player availability, and injury timelines serve as key variables that shift point spreads and prompt bettors to recalibrate stake sizes. Data from the 2025 season showed that quarterback absences altered spreads by an average of 4.2 points according to NCAA statistical reports, while running back injuries produced smaller average shifts of 2.1 points. Observers note that these movements occur because markets incorporate new information rapidly once official reports surface from team medical staffs.
Stake sizing models in this environment rely on probability estimates that incorporate both the magnitude of the spread change and the implied edge after the adjustment. Researchers at several university analytics programs have tracked how fractional adjustments to wager amounts, often between 1.5 and 3 percent of a bankroll, maintain risk parameters when timelines extend or shorten unexpectedly. The approach avoids fixed-percentage betting by scaling exposure in line with revised outcome probabilities derived from historical recovery data.
Tracking Official Injury Reports and Market Reactions
Teams release injury reports on a weekly schedule during the season, with additional updates issued on game days. These releases frequently trigger immediate spread movements of one to three points in major conference matchups. Bettors who monitor multiple reporting channels, including conference websites and local beat reporters, gain access to timeline refinements hours before broader market adjustments stabilize. In August 2026, the Big Ten and SEC implemented synchronized reporting windows that reduced the lag between initial announcements and spread recalibrations by approximately 40 minutes on average.
Spread markets price in recovery likelihoods based on injury type. Ankle sprains typically produce shorter timeline volatility than ACL reconstructions, yet the latter generate larger initial spread swings because recovery projections span multiple weeks. Studies from sports medicine databases indicate that 68 percent of reported timeline extensions occur within the first 10 days after an initial diagnosis, creating repeated opportunities for stake recalibration during that window.
Integrating Recovery Data into Probability Models
Adjusted stake sizing begins with baseline win probabilities calculated from team efficiency metrics and then layers on conditional probabilities tied to specific player absences. When a starting defensive end is ruled out for four weeks, models assign a revised probability distribution to the opposing team's rushing output. Those distributions feed directly into updated spread expectations and determine whether an existing position warrants an increased or decreased stake. Analysts who apply Monte Carlo simulations to these scenarios report that stake adjustments of 0.75 to 2.25 units produce more stable long-term results than static sizing across varied injury profiles.
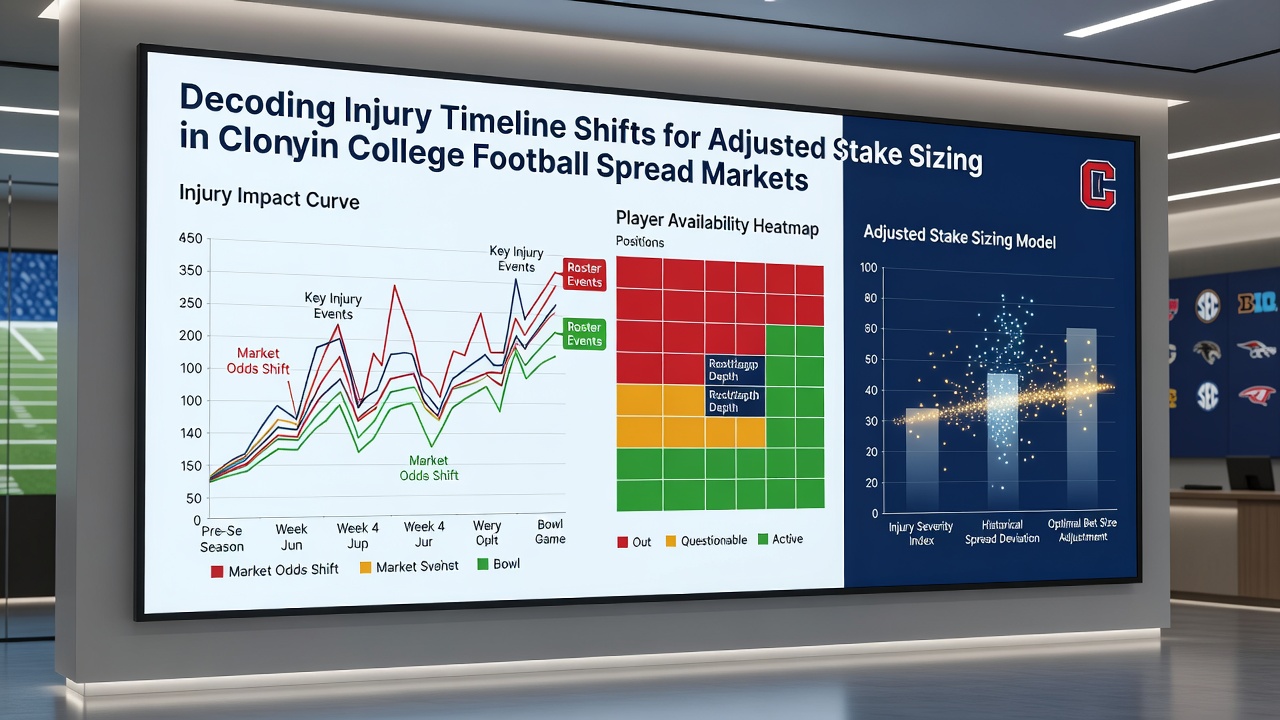
Historical recovery curves compiled by the American College of Sports Medicine show that certain position groups return to full participation at different rates. Wide receivers achieve 85 percent of pre-injury snap counts within three weeks of soft-tissue injuries, whereas offensive linemen require closer to five weeks on average. These differentials translate into asymmetric spread impacts that models capture when determining stake sizes for individual games.
Case Examples from Recent Seasons
One documented sequence during the 2025 campaign involved a top-10 team whose starting quarterback suffered a high-ankle sprain on a Thursday. Initial spread movement reached 3.5 points by Friday morning, yet subsequent medical updates released Saturday morning narrowed teh projected absence to a single game. Markets reversed 2 points of that movement within 90 minutes, and bettors who had scaled stakes downward after the first report faced a second adjustment window before kickoff. Records indicate that positions sized at 1.8 units before the reversal produced positive expected value once the timeline contracted.
Another sequence occurred in a Group of Five conference game where a star running back's participation status fluctuated across three separate reports. Each revision triggered a 1-point spread shift, and cumulative stake adjustments across the sequence remained below 2 percent of the total bankroll allocation for that matchup. The pattern illustrates how incremental timeline information allows for proportional stake recalibrations rather than wholesale position exits.
Regulatory and Data Environment in 2026
State gaming commissions in jurisdictions that permit college football betting require operators to display injury-related odds adjustments with clear timestamps. These rules emerged after 2024 legislation in multiple states mandated transparency around information sources used to move lines. Operators now publish the timestamp of each injury update alongside the corresponding spread change, giving bettors standardized data points for modeling purposes. Academic researchers have begun incorporating these timestamped datasets into longitudinal studies of market efficiency following injury announcements.
Conclusion
Stake sizing in college football spread markets incorporates injury timeline information through iterative probability updates that reflect both the length and certainty of reported absences. Models draw on historical recovery statistics, conference reporting protocols, and timestamped market movements to determine proportional adjustments. Data released by the NCAA and state regulatory bodies continues to expand the granularity available for these calculations, allowing market participants to align stake sizes with evolving participation forecasts throughout each week of the season.