Mapping Liquidity Dynamics Across Cricket Player Prop Markets in Global Series
Carlo Jung · Aug 18, 2026
Mapping Liquidity Dynamics Across Cricket Player Prop Markets in Global Series
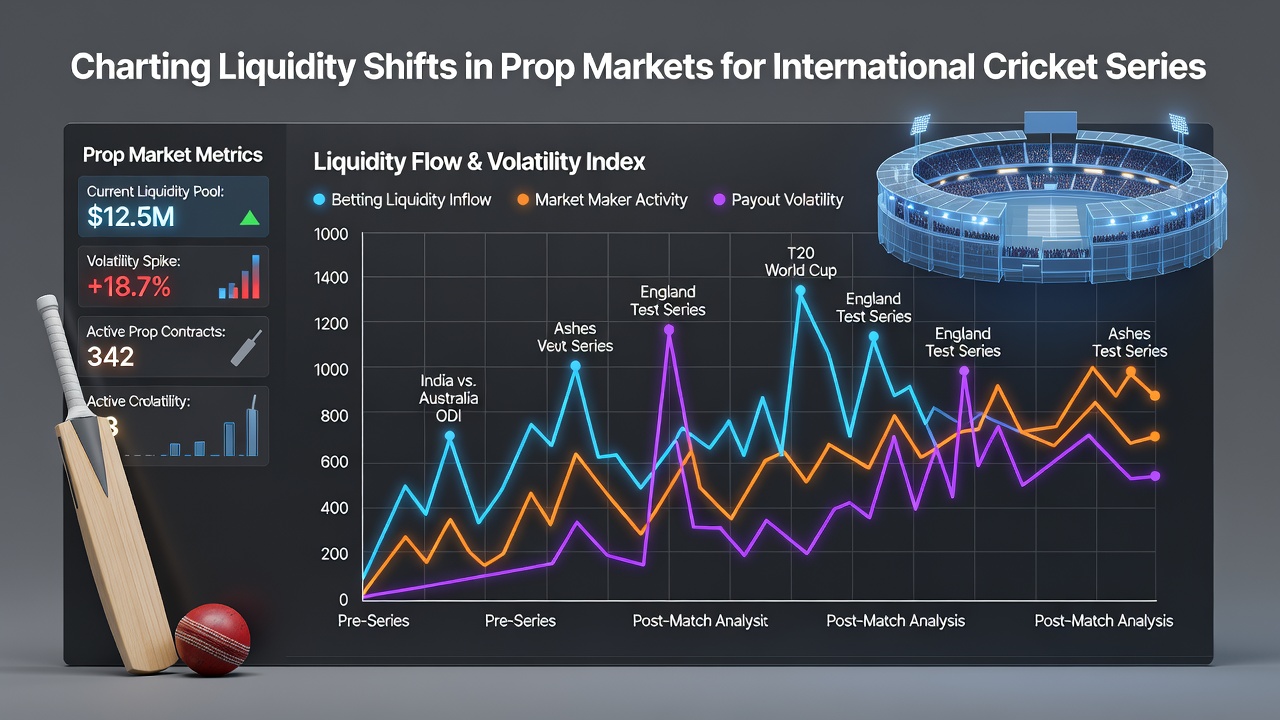
Prop markets in international cricket cover a wide range of player-specific outcomes such as runs scored by batters, wickets taken by bowlers, and catches completed in the field, with liquidity levels fluctuating based on match timing and series context. Data from betting platforms indicate that volume in these markets rises sharply in the 48 hours before a fixture when team announcements and pitch reports become available, then contracts during the opening overs before expanding again as in-play adjustments occur. Observers note that bilateral tours between teams like India and Australia generate higher baseline liquidity than one-off tournaments because sustained media coverage draws consistent participation from multiple regions.
Key Drivers of Liquidity Movement
Weather updates, injury reports, and historical head-to-head statistics influence order flow, while exchange operators adjust margins in response to incoming bets. Figures from industry reports reveal that total matched amounts in player prop markets can increase by 40 percent when a series features high-profile players whose recent form receives extensive coverage. Researchers at academic institutions have tracked how spreads narrow in the pre-match window for popular outcomes like top run-scorer, then widen once the toss occurs and live data feeds alter perceived probabilities. And because cricket matches span multiple days in Test formats, liquidity often migrates between sessions as overnight pitch degradation becomes clearer to participants.
Measurement Approaches Used by Analysts
Analysts track liquidity through metrics such as total matched volume, average bet size, and the depth of available odds at each price point. Studies conducted on historical data sets show that markets with over 500,000 units matched typically maintain tighter spreads throughout the session, whereas lower-volume props experience larger gaps when a single large wager arrives. Software tools aggregate these figures across multiple exchanges, allowing patterns to emerge around specific series stages. For instance, data compiled during the 2025 Australia versus England Ashes series demonstrated that wicket-taker props saw liquidity double in the final session of each day compared with the opening hour.
What's interesting is how format differences affect these patterns. T20 internationals produce concentrated liquidity spikes around powerplay overs and death phases, while ODI contests distribute volume more evenly across the full 50 overs. Reports from regulatory bodies in Australia highlight that participant numbers in cricket props rose steadily between 2023 and 2025, coinciding with expanded broadcast rights that increased global viewership. Those monitoring order books observe that sharp liquidity drops often precede major turning points, such as the fall of an opening batter, prompting rapid repricing across related props.
Examples from Scheduled 2026 Encounters
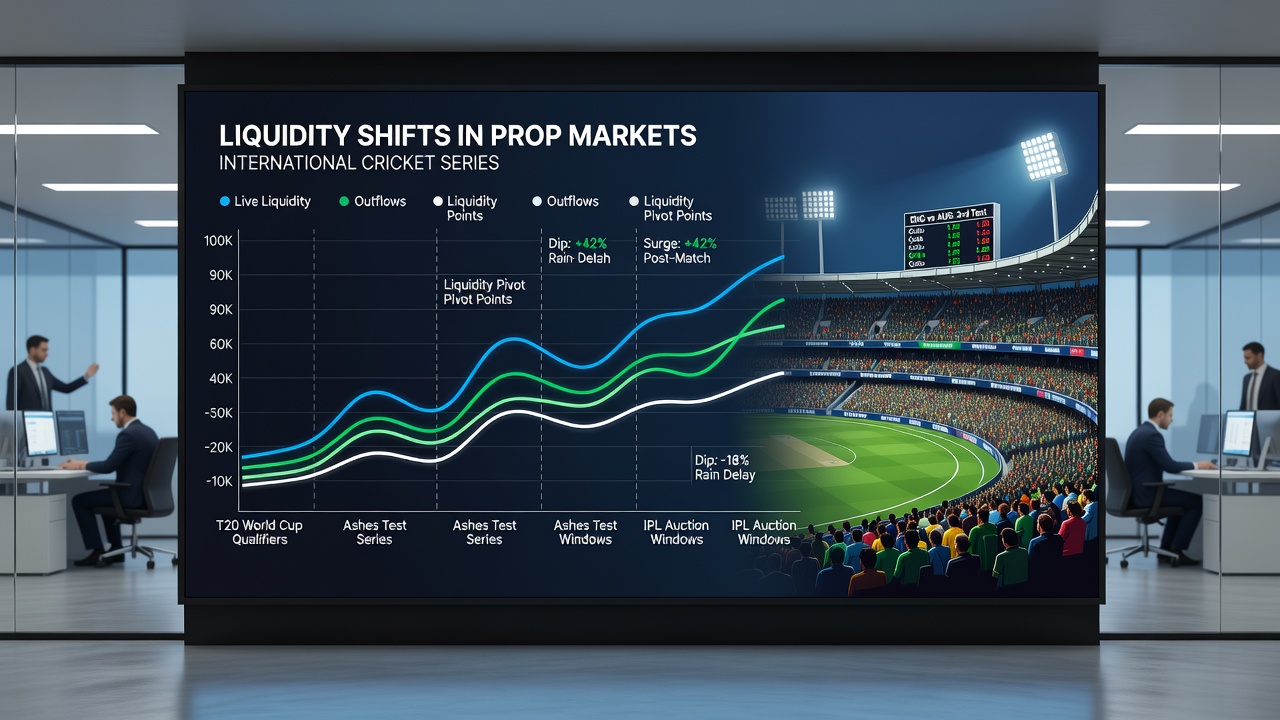
Upcoming fixtures in August 2026 include a five-match T20 series between South Africa and Pakistan, where analysts anticipate elevated activity in all-rounder performance props given the players' dual contributions. Historical patterns indicate that liquidity in these markets builds gradually over the first two matches as participants gather comparative data, then accelerates once team combinations stabilize. Similar trends appeared during the 2024 India versus Sri Lanka tour, where catch props for specific fielders attracted growing matched amounts as the series progressed and fielding positions became more predictable.
Exchange operators report that cross-market correlations strengthen during these periods, with liquidity shifts in one prop often triggering adjustments in related outcomes such as total team runs. Academic papers examining betting data from multiple jurisdictions confirm that such correlations intensify when series reach decisive stages, particularly in best-of-three or best-of-five formats. Participants using automated monitoring systems receive alerts when depth at key price levels changes beyond preset thresholds, enabling timely responses to emerging opportunities.
Regional Variations in Market Participation
Participation levels differ by region, with stronger activity from South Asian and Australian accounts during matches involving those nations. Government statistics released by authorities in Canada show steady growth in interest from North American users for major cricket events, although volumes remain smaller than those recorded in primary markets. This geographic spread contributes to round-the-clock order flow, reducing the duration of low-liquidity windows that once occurred during off-peak hours. Industry associations note that improved data feeds from stadium sensors have further supported tighter pricing across props by supplying real-time inputs that participants incorporate into their models.
Conclusion
Liquidity charting in cricket prop markets relies on continuous monitoring of volume, spread behavior, and external information flows. Series schedules set for 2026 provide fresh data points that will allow further refinement of existing analytical frameworks. Observers expect continued evolution in how these markets respond to format changes and technological enhancements in broadcasting and data collection.